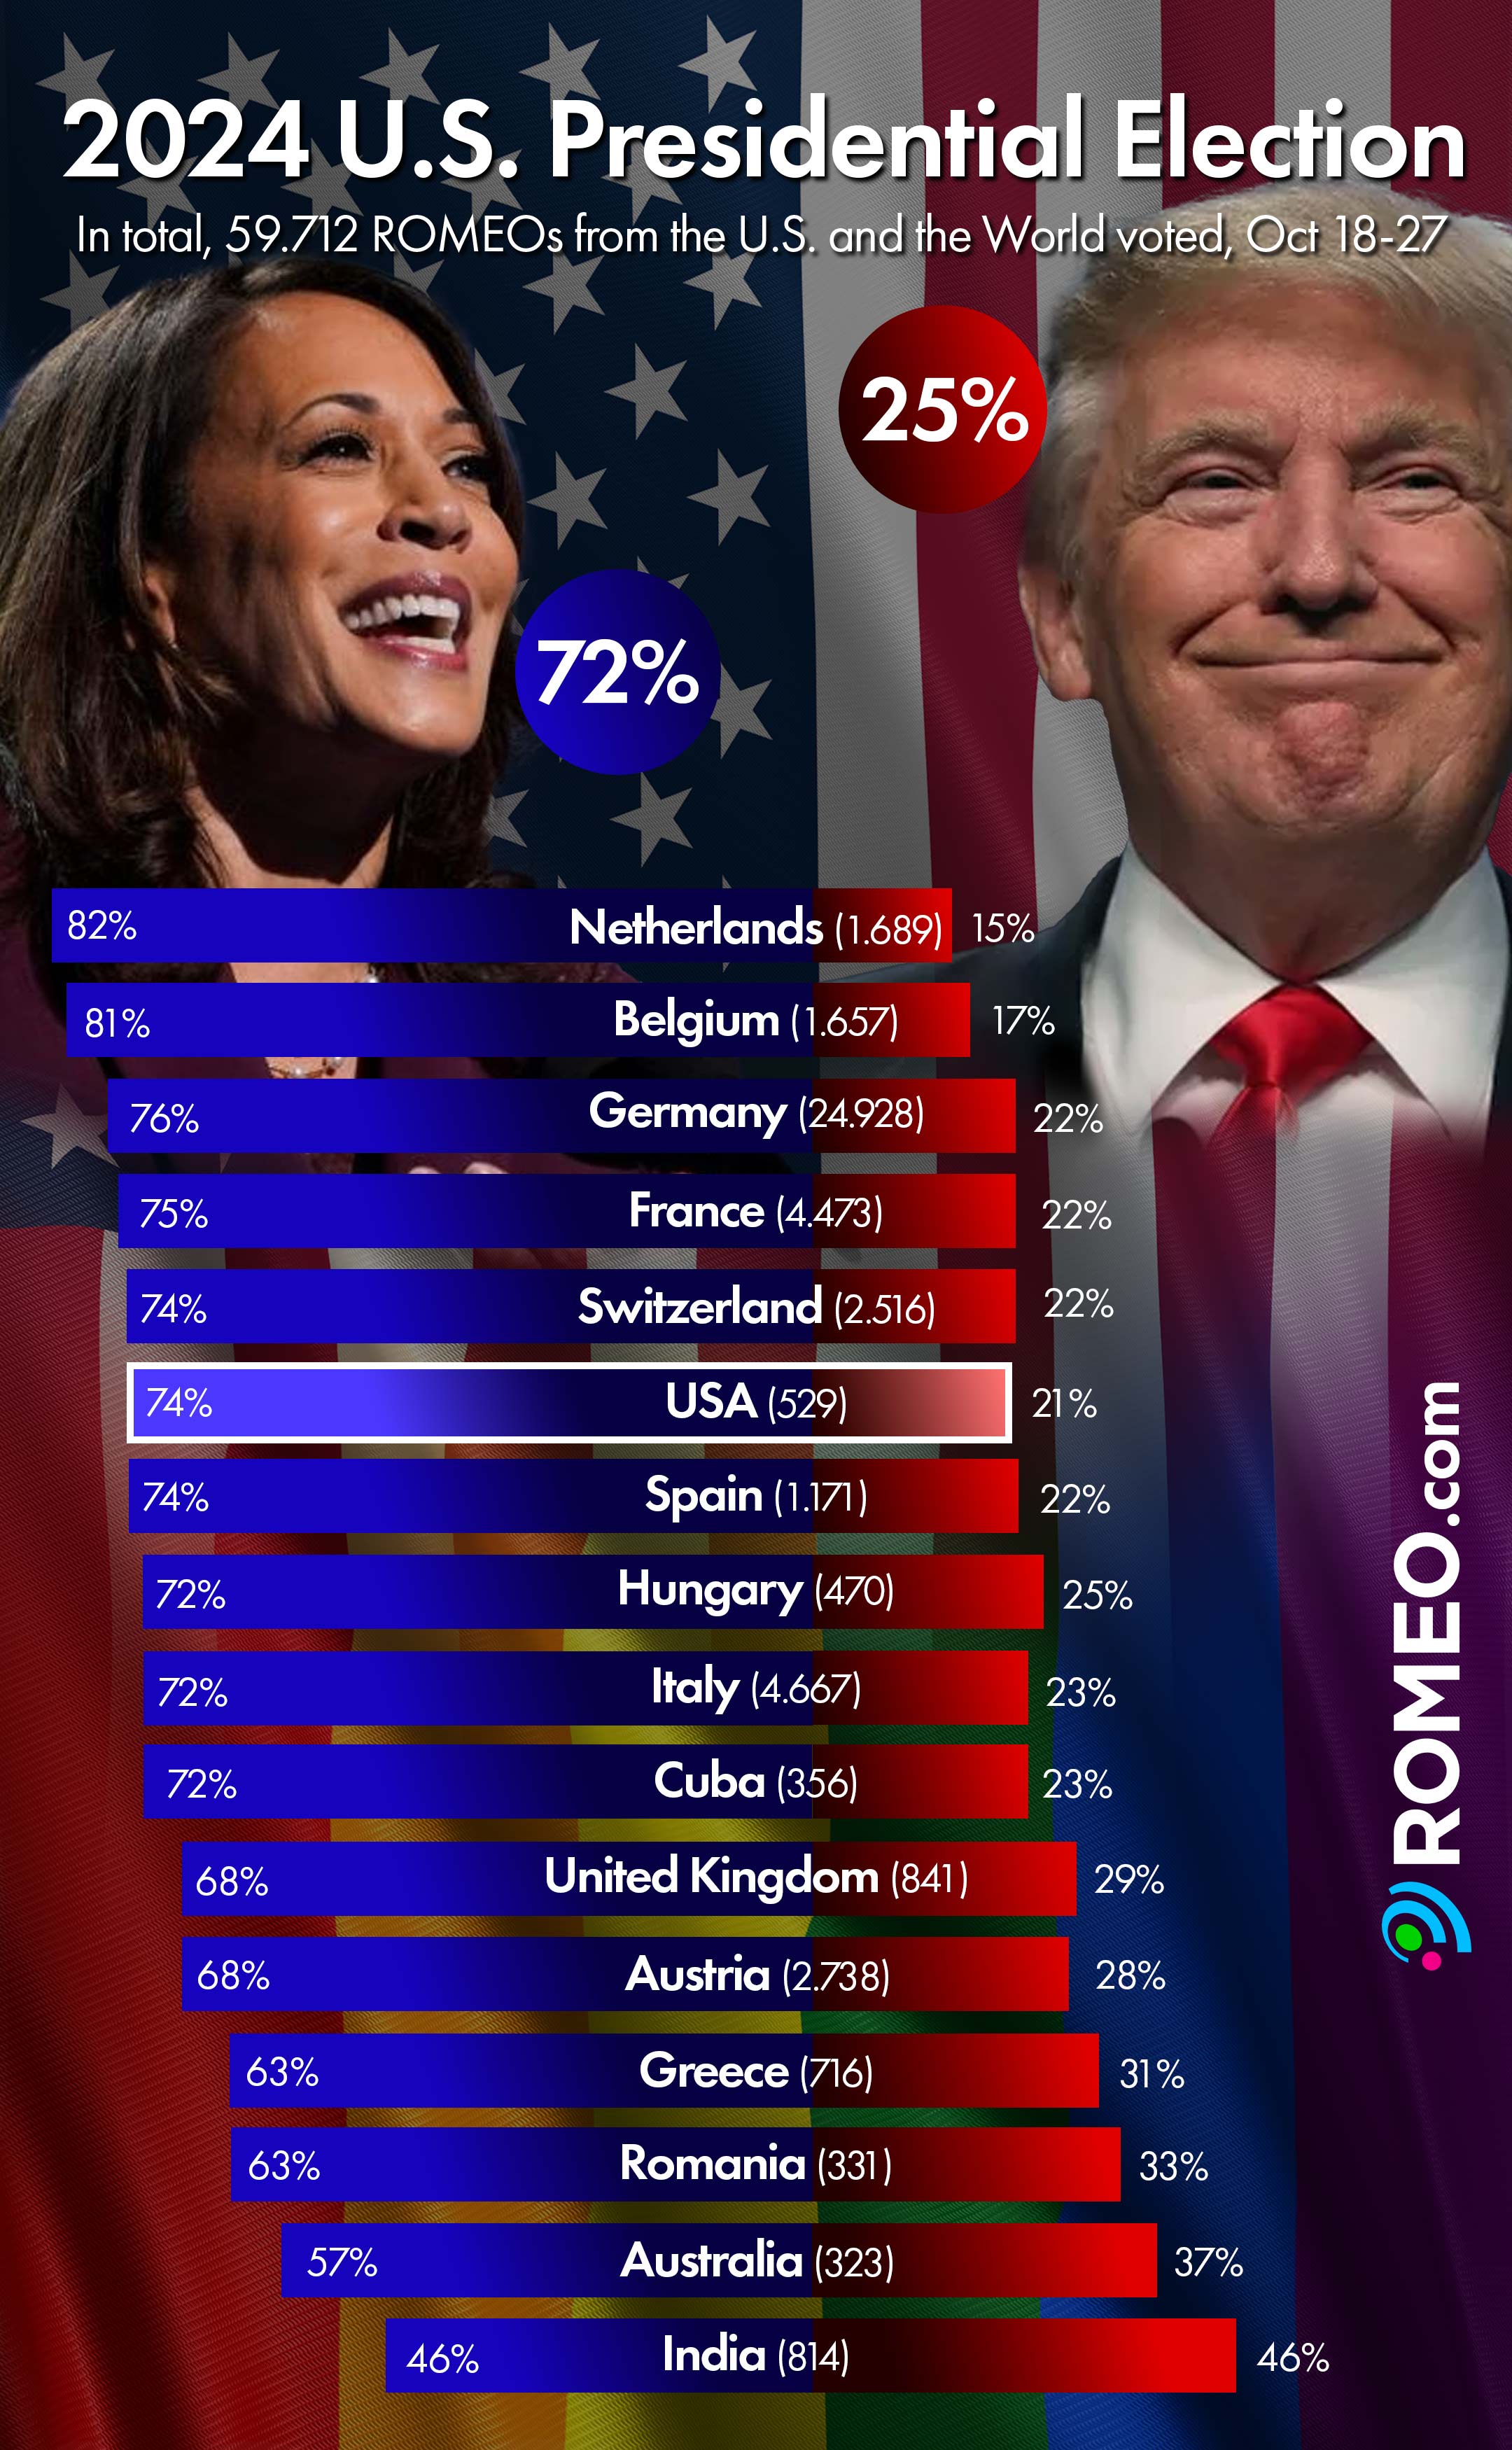
With the excitement around the upcoming U.S. elections, we couldn’t help but wonder: how would ROMEOs cast their votes? Since we do not have so many users in the USA 😟, we thought to ask all ROMEOs worldwide since If there’s one election everyone’s talking about, it’s this one! 🇺🇸
Here’s how 529 U.S. ROMEOs voted: 🌎
- Kamala Harris (Democratic): 73,9%
- Donald Trump (Republican): 21,2%
- Other: 4,4%
Surprisingly, the rest of the world mirrored the U.S.’s results! A little transatlantic mind-reading? 🤔

Will these results hold up on election day? Well, that’s the million-dollar question! 💸 We’ll find out together after November 5th. No matter who wins, we hope they don’t take our poll’s results too personally or make it a diplomatic revenge list. 😜
Happy elections to all ROMEOs from the U.S!
Keep the conversation going and tell us what you think on X.com!
Method & Limitations
Most election surveys overlook LGBTQ+ perspectives, which is why our election polls aim to give voice to LGBTQ+ perspectives by gathering insights from ROMEO users in countries where we have a strong presence.
The survey link is sent directly to users through in-app messages, and participation is voluntary and anonymous. We keep it straightforward, asking only about age and voting intentions.
While our approach isn’t designed for statistical predictions, it offers a broad view of LGBTQ+ political preferences. Additionally, it’s worth noting that the large group of lesbians isn’t represented on ROMEO.
Lastly, we ask for understanding that we don’t offer any interpretation of the results. We see ourselves as impartial ambassadors of our users and hope our data contributes to societal discourse, dismantles biases, and amplifies the LGBTQ+ voice in politics.

